Music Analysis
August 13, 2014
In the dim past, our
ancestors found that they could make
sound by beating on hollow
logs and shaking
seeds in dried
gourd shells. From that time until the late
19th century, we could only experience sound
aurally. An additional means of sensing sound appeared in 1880, when
Alexander Graham Bell, assisted by
Charles Sumner Tainter, invented the
photophone.[1]
Bell's photophone used a
flexible mirror to convert sound waves into a
modulated light beam.
Acoustic vibrations would
deform the mirror to
focus and de-focus light, thereby changing the light
intensity in response to the sound intensity. I wrote about the photophone in a
previous article (Free-Space Optical Communications, August 18, 2011).
There was a receiver part of a photophone that converted the modulated light to an
alternating current signal with a
selenium photoresistive cell. The photophone transmitter, however, was a
passive device that required no
electricity to operate. As a consequence, the light modulation wasn't that strong.
With the advent of
vacuum tube electronics, a different type of sound-to-light converter was invented by
William Duddell (1872-1917). His
electromagnetic oscillograph, as shown in the figure, used
electromagnets to move a mirror to produce a bouncing light beam similar to what's displayed on the now familiar
cathode ray oscilloscope. A description of a similar electromagnetic oscillograph is given in the references.[2]
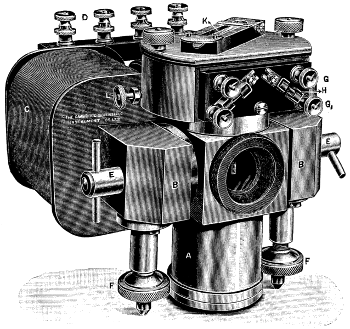
A Duddell oscillograph.
This electromechanical instrument could respond to frequencies up to the kilohertz range. The primary elements were the electromagnet coils (C) and their cores (B).
(From vol. 6 of Hawkins Electrical Guide, Theo. Audel & Co., 1917, via Wikimedia Commons.)
The electromechanical oscillograph was superseded by the cathode ray oscilloscope, which responded to much higher frequencies. A popular
science demonstration in my
childhood was showing a
person's voice on an oscilloscope. In that case, the oscilloscope functioned more like a light show than an
analytical instrument.
The idea of a sound-driven light show was popularized as the "
color organ"
circuit (a.k.a.,
light organ) by which the intensity of sound in different
audio frequency bands was displayed as multi-colored lights. In my
undergraduate days, I designed and built a five channel color organ using
Sallen-Key filters as the
bandpass filters, and
triacs to control the lights.
The advent of ubiquitous
computing devices has led to many ways to visually display
music. The simplest of these is the
bargraph spectrum analyzer that shows the sound intensity in many small bandwidth slices across the audio band. You can see the operation of one of these in
this YouTube video.
Of course,
computers can do much more than just present the intensity distribution of the frequencies in an acoustic source. There's the capability for
analysis. In an
earlier article (Scoring the Hits, January 4, 2012), I summarized research into the computer analysis of music, both for selecting
tunes similar to others, and for predicting the next best-selling songs.[3-5] Every
record label wants a machine that would automatically
sort the musical wheat from its chaff.
Although the particular
orchestration and
vocal artist are big factors in making a
record a hit, let's just consider the
melody. What does it take to distinguish one tune from another? As I estimated in
a very old article (Name That Tune, June 24, 2008), each
note in a melody, except for the first, could possibly have 1 of 48 different combinations of
pitch (8) and
duration (6). We're only considering
popular music, so we're not going as far as needing
twelve tones in our scale. There are also rogue notes, appropriately called
accidentals, that inflate this number, but our
calculation is a
Fermi problem, so we'll ignore them.
For technical reasons, the pitch of the first note, which sets the
tonic, is not important, only its duration, which would be about one in six different choices. To honor the recent
passing of
James Garner, I'll use
Mike Post's opening theme to
The Rockford Files as an example. The initial
musical phrase, which instantly identifies this melody, has ten notes. This is just one melody of 6 x (48)
9 = 8,115,632,763,568,128 possible ten note melodies.
Just as in
English, where "u" will follow "q" with nearly a hundred percent certainty, there's a greater
probability that some note will follow others in a melody. This reduces the number of "musical" melodies considerably, so that there are actually more like 10
12 "musical" melodies. This is a large number, but much smaller than 10
16. It still appears that an adequate analysis might need a
supercomputer.
This
estimate shows that there are still many more songs forthcoming from "
Tin Pan Alley," which has apparently emigrated to
Sweden, as the
composition credits of
Max Martin demonstrate. Instead of tackling the problem of deciding which new melodies will be hits, two
computer scientists at
Lawrence Technological University (Southfield, Michigan) have developed an
artificial intelligence algorithm for analysis and comparison of musical styles. Interestingly, they use audio analysis tools they had developed for analysis of
whale song.[6-7]
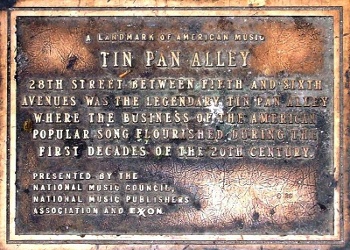
A plaque marking the area of Tin Pan Alley in New York City.
London, England, has its own Tin Pan Alley at Denmark Street.
(Photograph by Ben Sutherland, via Wikimedia Commons.)
Their analysis program takes as an input the audio recording, itself.[6-7] This is converted into a series of
spectrograms, and they use
image analysis techniques to convert these into a set of 2883 numbers that allow comparison with other pieces of music.[6-7] The comparison between songs is done using the common
weighted K-nearest neighbor scheme by which it was possible to automatically arrange the thirteen
Beatles studio albums in their
chronological order.[6-7] The algorithm correctly placed "
Let It Be," the last released album, before "
Abbey Road," a fact consistent with their recording
chronology.[7] Similar results were obtained for other
musical groups.
The algorithm attempts to derive a representation of a recording's "
DNA." The utility of this type of analysis is highlighted by the recently announced
acquisition of
Booklamp by
Apple. Booklamp worked on what it called its Book Genome Project that analyzed book qualities like
action,
viewpoint and
dialog to derive a book's "DNA."[8]
References:
- A.G. Bell, "Apparatus for Signaling and Communicating, called Photophone," US Patent No. 235,199, December 7, 1880.
- Howard L Daniels, "Electromagnetic oscillograph," US Patent No. 2,466,691, April 12, 1949.
- Alok Jha, "Music machine to predict tomorrow's hits - Scientists teach computer how to analyse songs," The Guardian (UK), January 16, 2006.
- by Laura Sydell, "New Music Software Predicts The Hits," NPR, October 12, 2009.
- Joanne Fryer, "Can science predict a hit song?" University of Bristol Press Release, December 17, 2011.
- Joe George and Lior Shamir, "Computer analysis of similarities between albums in popular music," Pattern Recognition Letters, vol. 45, (August 1, 2014), pp. 78-84.
- Artificial intelligence identifies the musical progression of the Beatles, Lawrence Technological University Press Release, July 24, 2014.
- Nate Hoffelder, "Apple Acquires Booklamp," Digital Reader, July 25, 2014 .
Permanent Link to this article
Linked Keywords: Ancestor; sound; log; seed; gourd; 19th century; hearing; aural; Alexander Graham Bell; Charles Sumner Tainter; photophone; deflection; flexible; mirror; modulation; modulated; light beam; acoustic vibration; plasticity; deform; focus; intensity; alternating current; signal; selenium; photoresistor; photoresistive cell; passive device; electricity; vacuum tube; electronics; William Duddell (1872-1917); electromagnetic oscillograph; electromagnet; cathode ray oscilloscope; frequency; hertz; kilohertz; electromagnet coil; magnetic core; Wikimedia Commons; science demonstration; childhood; human voice; analytical instrument; color organ; electronic circuit; light organ; audio frequency band; undergraduate; Sallen-Key filter; bandpass filter; triac; computing device; music; bargraph; spectrum analyzer; YouTube video; computer; analysis; tune; record label; winnowing; wheat; chaff; orchestration; singing; vocal artist; record; melody; note; pitch; duration; popular music; chromatic scale; twelve tone scale; accidental; calculation; Fermi problem; tonic; death; passing; James Garner; Mike Post; theme music; opening theme; The Rockford Files; musical phrase; English language; probability; supercomputer; estimate; Tin Pan Alley; Sweden; musical composition; Max Martin; computer scientist; Lawrence Technological University (Southfield, Michigan); artificial intelligence; algorithm; whale vocalization; whale song; New York City; London, England; Denmark Street; Ben Sutherland; spectrogram; image analysis; K-nearest neighbors algorithm; weighted K-nearest neighbor scheme; The Beatles; studio album; chronological order; Let It Be; Abbey Road; chronology; musical ensemble; musical group; DNA; acquisition; Booklamp; Apple Inc.; action; viewpoint; dialog; A.G. Bell, "Apparatus for Signaling and Communicating, called Photophone," US Patent No. 235,199, December 7, 1880; Howard L Daniels, "Electromagnetic oscillograph," US Patent No. 2,466,691, April 12, 1949.