Sloan Digital Sky Survey MaNGA
March 4, 2019 My first exposure to Japanese kawaii culture was a Hello Kitty plush doll purchased for my daughter decades ago. This was a time long before the ubiquity of the Internet and Sanrio's substantial market penetration into the US. The kawaii influence is also expressed in many manga magazines and anime television series, such as Eromanga Sensei.
Kanji for "manga" and a manga example image. (Kanji characters, and manga image of "Mahuri" by Niabot, via Wikimedia Commons
Acronyms abound in our modern age as people seek abbreviated expressions for increasingly complex scientific discoveries and technologies. Physicists soon tired of reciting "weakly interacting massive particles" for the hypothetical particles that interact mostly by gravitation and may constitute dark matter. These are now called "WIMPs," and how can you have a wimp without a complementary macho, a massive astrophysical compact halo object, an interstellar object composed of dark ordinary matter such as neutron stars and brown dwarfs that may also explain dark matter. Unlike acronyms like NASDAQ, NASA, laser, and radar, that are built from the first letters of their description, WIMPs and MACHOs are acronyms based on actual words. It's that quality that makes them more memorable. That's why a Sloan Digital Sky Survey (SDSS) program, Mapping Nearby Galaxies at Apache Point Observatory, is called MaNGA. The 15th and latest release of MaNGA data of nearly 5,000 nearby galaxies observed during the first three years of the program has just been released.[1-3] It's strange to think that only a century ago astronomers thought that our Milky Way galaxy was the full extent of the universe. The Milky Way makes a fine universe, indeed, since it has between 100 and 400 billion stars located in a 150-200 thousand light year region of space. Space beyond this was thought to be empty. There were hints of unusual objects, at that time called spiral nebulae, in astronomical observations, but it was only until a "Great Debate" between two prominent astronomers in 1920 that the existence of other galaxies gained prominence.

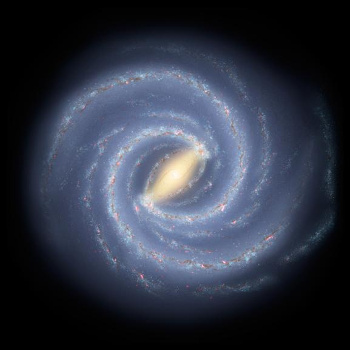
Artist's conception of the Milky Way galaxy, based on data from the Spitzer Space Telescope.
We can't photograph our own galaxy, since we live inside it, but we're able to determine its structure through such observations as the radio emission of its contained hydrogen gas.
(NASA/JPL-Caltech image PIA10748.)
This Great Debate on April 26, 1920, at the Smithsonian Museum of Natural History was between Harlow Shapley (1885-1972), director of the Harvard College Observatory, and Heber Curtis (1872-1942), a past president of the Astronomical Society of the Pacific and director of the Allegheny Observatory. Shapley believed that the nebulae were objects at the periphery of the Milky Way, while Curtis thought that they were large and distant independent galaxies. Curtis' theory has been proven to be correct, since we now know that there may be a trillion galaxies in a universe that's nearly a hundred billion light years in size. Shapley redeemed himself in 1953 with his "liquid water belt" theory, an idea now known as the circumstellar habitable zone, the region of planetary orbits around stars where life might be found. As the SDSS MaNGA project demonstrates, modern technology has enabled rapid observation and spectral classification of astronomical objects. The goal of MaNGA is the study of more than 10,000 nearby galaxies, and this survey is nearly at the halfway mark. The 15th data release was the product of a huge international team. The full author list and affiliations take 2-1/3 pages with 234 authors by my count. Last, but not least, among alphabetical authors was Hu Zou of the National Astronomical Observatories, Chinese Academy of Sciences, People's Republic of China.[1] This paper is published under the Creative Commons Attribution 3.0 license.[1] The Sloan Digital Sky Survey began twenty years ago, and this 15th data release covers its "Phase-IV" period from July, 2014, through July, 2017.[1] SDSS-IV will continue in its collection of astronomical data until 2020, but it will be followed by SDSS-V that will run from 2020 through 2025.[1] The present data release contains optical imaging, optical spectroscopy, and infrared spectroscopy with optical and infrared spectroscopy from the 2.5 meter Sloan Foundation Telescope at Apache Point Observatory and infrared spectroscopy from the du Pont Telescope at Las Campanas Observatory.[1] Data from 4,621 galaxies are now publicly available as part of this data release.[2] MaNGA uses what's called integral-field spectroscopy, a technique that examines galactic spectra across the entire face of target galaxies using fiberoptic bundles.[2] Previously, astronomers acquired just a single spectrum for each galaxy, but integral field spectroscopy obtains hundreds of separate spectra over the full spatial extent of the galaxy.[2] Says MaNGA principal investigator, Kevin Bundy, an associate researcher at the University of California Observatories and adjunct professor of astronomy and astrophysics at the University of California, Santa Cruz,
"Resolved spectroscopy allows us to dissect a galaxy and study its internal composition and the motions of its stars and gas... People have been doing resolved spectroscopy for individual galaxies, but we've never had it for thousands of galaxies, so MaNGA gives us the statistical power to address a lot of important questions... This data release is a major milestone for us. MaNGA is already by far the largest survey of its kind, and this release includes both the data and the analytical tools the project has developed."[2]

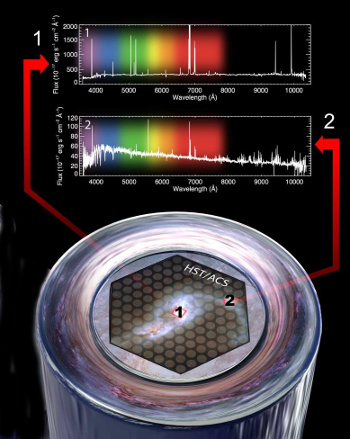
MaNGA fiberoptic bundle spectroscopy.
MaNGA spectra are obtained across the entire face of a galaxy through the use of fiberoptic bundles onto which the galaxy is imaged, as seen in the lower part of this figure.
Each fiber in the array terminates in a spectrograph, so spectral samples can be obtained in small regions across the full extent of a particular galaxy.
In the example shown, two different places in a galaxy exhibit dramatically different spectra.
(Dana Berry/SkyWorks Digital Inc., David Law, and the SDSS collaboration image, via the University of California Santa Cruz, also available here. Click for larger image.)
Access to MaNGA data is through a data visualization tool on a website called "Marvin."[1,3] Marvin has tools for searching, accessing, and visualizing the data, and it has easy access to a wealth of information about each galaxy, including maps of key features such as star formation, stellar motion, and emission lines.[2] The website also includes an image roulette feature that selects random galaxies for viewing.[3] The large number of galaxies studied will give information about the life cycle of present-day galaxies, from their birth, through growth from star formation, to their demise from diminished star formation late in life.[2] There's a theory that outflows of hot ionized gas from a galaxy's central black hole can shut down star formation, and some MaNGA data support this.[2] Not only are galaxies being observed, but also spectra of stars in our Milky Way galaxy. Spectra for 3,000 stars are in the present data release, and another 2,000 to 3,000 are expected to be observed.[2] Says Bundy,
"The MaNGA Stellar Library is the largest library of stars ever compiled, with spectra from the same instruments used for the galaxies, so it's a very powerful tool for understanding the nature of the stellar populations in these galaxies."[2]

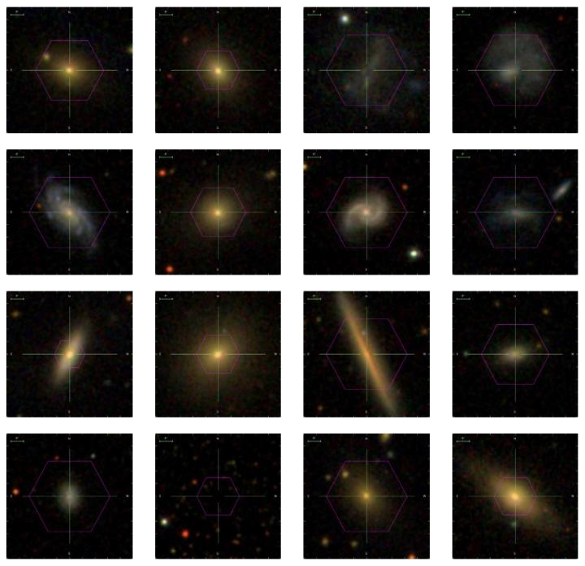
Marvin galaxies example. The survey will eventually include more than 10,000 nearby galaxies. (SDSS/MaNGA collaboration image via the University of California Santa Cruz, also available here.)
Funding for the Sloan Digital Sky Survey IV was provided by the Alfred P. Sloan Foundation, the U.S. Department of EnergyOffice of Science, and the participating institutions.[2]
References:
- D. S. Aguado, et al., "The Fifteenth Data Release of the Sloan Digital Sky Surveys: First Release of MaNGA-derived Quantities, Data Visualization Tools, and Stellar Library," The Astrophysical Journal Supplement Series, vol. 240, no. 2 (January 31, 2019). This is an open access article with a PDF file here.
- Tim Stephens, "MaNGA data release includes detailed maps of thousands of nearby galaxies," University of California, Santa Cruz, Press Release, January 29, 2019.
- Marvin Website.