Hedonometrics
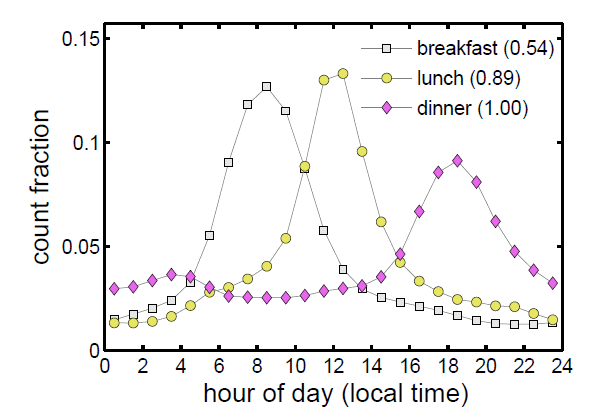
January 31, 2011 When I was a child, dinnertime was promptly at 5:00 PM. The time was chosen principally to accommodate my father, who arrived home hungry at 4:30 PM after a long day in building construction. I was surprised to find that some of my schoolmates had dinner at a much later time, sometimes as late as 7:00 PM. Was my family dinner time unusually early, or was their dinner time unusually late? I didn't have enough data to decide. Well, the wonders of computer science, data mining and Twitter have converged to give me an answer. Six PM is the time most people have dinner, although anytime from 5:00 PM - 7:00 PM is nearly as likely (see figure).[1] Meal times as divined by data mining Twitter. (Fig. 1A from Ref. 1)
Social networks are being data mined by computer scientists who have derived some very interesting results. In a recent article (Dialect, January 10, 2011), I wrote about one Twitter data mining exercise that mapped the regional dialects of English that are used in the United States.[2] Another article that involves data mining Twitter has been written by members of the Department of Mathematics and Statistics and the Vermont Advanced Computing Center, University of Vermont (Burlington, VT), who have posted it on the arXiv Preprint Server and sent it for publication to PLoS ONE.[1] The objective of their study is the measurement of happiness; or, at least, the frequency of occurrence of words and phrases that express happiness.
The authors of this study agree with the maxim that money doesn't buy happiness, and they decided to eschew the usual economic indicators of happiness for a more direct measure. They call their Twitter data mining approach, which functions in real-time on potentially 50 million individuals, a hedonometer, from the Greek words for pleasure and measurement. In their research exploration, they used a static dataset of more than 28 billion words to examine the temporal variations in happiness over time scales of hours, days, and months.
Which words are happy words, and which words are sad words? The research team used the results of the 1999 Affective Norms for English Words (ANEW) study of Bradley and Lang.[3] The ANEW is a collection of 1034 words that were presented to a large group of individuals who were asked to rate each on a scale of 1 (feeling completely unhappy, annoyed, unsatisfied, melancholic, despaired or bored") to 9 ("feeling completely happy, pleased, satisfied, contented or hopeful"). Some examples are love (8.72), food (7.65), reunion (6.48), greed (3.51), hate (2.12) and funeral (1.39).
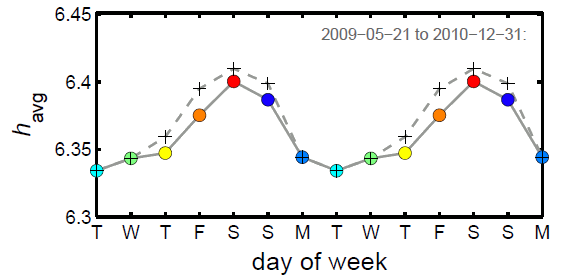
As a "sanity check," it's noted that neutral words, such as barrel (5.05) and chair (5.08) placed squarely in the mid-range. I must admit that my favorite chair would be somewhat higher on my scale; and then there's the problem of 'chairness' that I discussed in a previous article (The Quality of Chairness, December 3, 2010). The following table shows the happiness index for various text examples, and we can see from the figure how happiness varies with the day of week.[1] I've always found Tuesdays to be bad days, and these data confirm my observations. Not surprisingly, everyone likes Saturdays, although the absolute range of the happiness index is not that large.
Text Source | h-index |
Soul/Gospel music lyrics | 6.9 |
Dante's Paradise | 6.5 |
Rock music lyric | 6.3 |
New York Times(1987-2007) | 6.0 |
Dante's Inferno | 5.5 |
Metal/Industrial music lyrics | 5.4 |
 Happiness throughout the week (Fig. 3 from Ref. 1)
Sure, happiness is interesting, but once you've done the obvious things, such as the result in the day-of-week correlation, and monitoring whether happiness has increased in the current year over the prior year, is there anything else? One other thing the research team did is to check the difference in happiness index of tweets that contained certain words or proper names over the average tweet. I find this to be the more interesting result, as shown in the Table.
Word | h(diff) | . | Word | h(diff) |
love | 1.42 | . | gay | -0.09 |
happy | 1.32 | . | Republican | -0.13 |
cash | 1.21 | . | Democrat | -0.23 |
vacation | 1.11 | . | Senate | -0.29 |
Christmas | 1.03 | . | Sarah Palin | -0.34 |
God | 0.95 | . | Obama | -0.35 |
party | 0.93 | . | economy | -0.36 |
sex | 0.89 | . | Congress | -0.36 |
family | 0.79 | . | Muslim | -0.42 |
sun | 0.65 | . | climate | -0.44 |
life | 0.5 | . | oil | -0.53 |
hope | 0.48 | . | Islam | -0.54 |
heaven | 0.43 | . | Lehman Brothers | -1.08 |
income | 0.36 | . | Goldman Sachs | -1.08 |
friends | 0.33 | . | Afghanistan | -1.15 |
Jesus | 0.27 | . | Iraq | -1.37 |
girl | 0.25 | . | gun | -1.81 |
USA | 0.23 | . | hate | -2.43 |
health | 0.2 | . | hell | -2.49 |
coffee | 0.04 | . | war | -2.63 |
church | 0.03 | . | depressed | -2.64 |
work | 0.02 | . | headache | -2.83 |
References:
- Peter Sheridan Dodds, Kameron Decker Harris, Isabel M. Kloumann, Catherine A. Bliss and Christopher M. Danforth, "Temporal patterns of happiness and information in a global social network: Hedonometrics and Twitter," arXiv Preprint Seriver, January 26, 2011.
- Jacob Eisenstein, Brendan O’Connor, Noah A. Smith and Eric P. Xing, "A Latent Variable Model for Geographic Lexical Variation," Preprint of paper presented at the Linguistic Society of America 85th annual meeting (Pittsburgh, PA), January 8, 2011
- M. Bradley and P. Lang, Technical report C-1, University of Florida, Gainesville, FL (1999).
- Jacob Eisenstein, Brendan O’Connor, Noah A. Smith and Eric P. Xing, "A Latent Variable Model for Geographic Lexical Variation," Preprint of paper presented at the Linguistic Society of America 85th annual meeting (Pittsburgh, PA), January 8, 2011